Stop Counting Vulnerabilities

Every quarter someone asks how many vulnerabilities are open, and the number goes on a slide. If it went down, the meeting moves on. Nobody in the room can say whether the findings that closed were the ones an attacker would have used, or whether the scanner behind the number looked at everything you run.
My position is that the open-finding count is a capacity measure being used as a risk measure, and that this steers engineers toward the wrong work. That is my argument, not a research result. The public sources I cite below are about what decides outcomes, and none of them turns on a count of open findings.
Why the count feels right and then fails
The count is easy to produce, easy to chart, and it responds when people work hard. The trouble is what it rewards.
Take two teams as a thought experiment. One spends a sprint bumping a shared dependency, which clears a long tail of low-severity findings across many images. The other spends it moving one internet-facing service off a version with a flaw on CISA's exploited list. The first team's chart looks wonderful. The second team moved the count by one.
The clock the count ignores is short. The 2026 Verizon DBIR says 31% of breaches now start with software vulnerabilities, for incidents between 1 November 2024 and 31 October 2025. Its executive summary puts credential abuse, the previous leader, at 13%. Mandiant's analysis of 2023 put average time-to-exploit at five days, and 56% of n-days, the flaws exploited after a patch exists, were exploited within a month. A number reviewed once a quarter cannot tell you whether you beat a clock like that.
Incident reviews do not read like tallies either. GAO's report on the 2017 Equifax breach, in which attackers accessed personal information of at least 145.5 million individuals, reports four major factors from Equifax's own investigation: identification, detection, segmenting of access to databases, and data governance. How many findings were open is not on that list.
What CISA asks instead
The most useful public template I know of is a federal directive. BOD 22-01, from November 2021, tied deadlines to the Known Exploited Vulnerabilities catalog, with a default of two weeks for CVEs from 2021 on and six months for older ones.
BOD 26-04 replaced it on 10 June 2026. Urgency now comes from four questions about a vulnerability on a specific asset. Is the asset publicly exposed? Is the CVE in KEV? Can an adversary automate every step of the exploit? Does exploitation give partial or total control? BleepingComputer's report puts the tightest deadline at as little as three days.
None of the four inputs is how many findings are open. The directive binds federal civilian agencies, not most readers, but I would borrow from it anyway.
Three numbers worth reporting
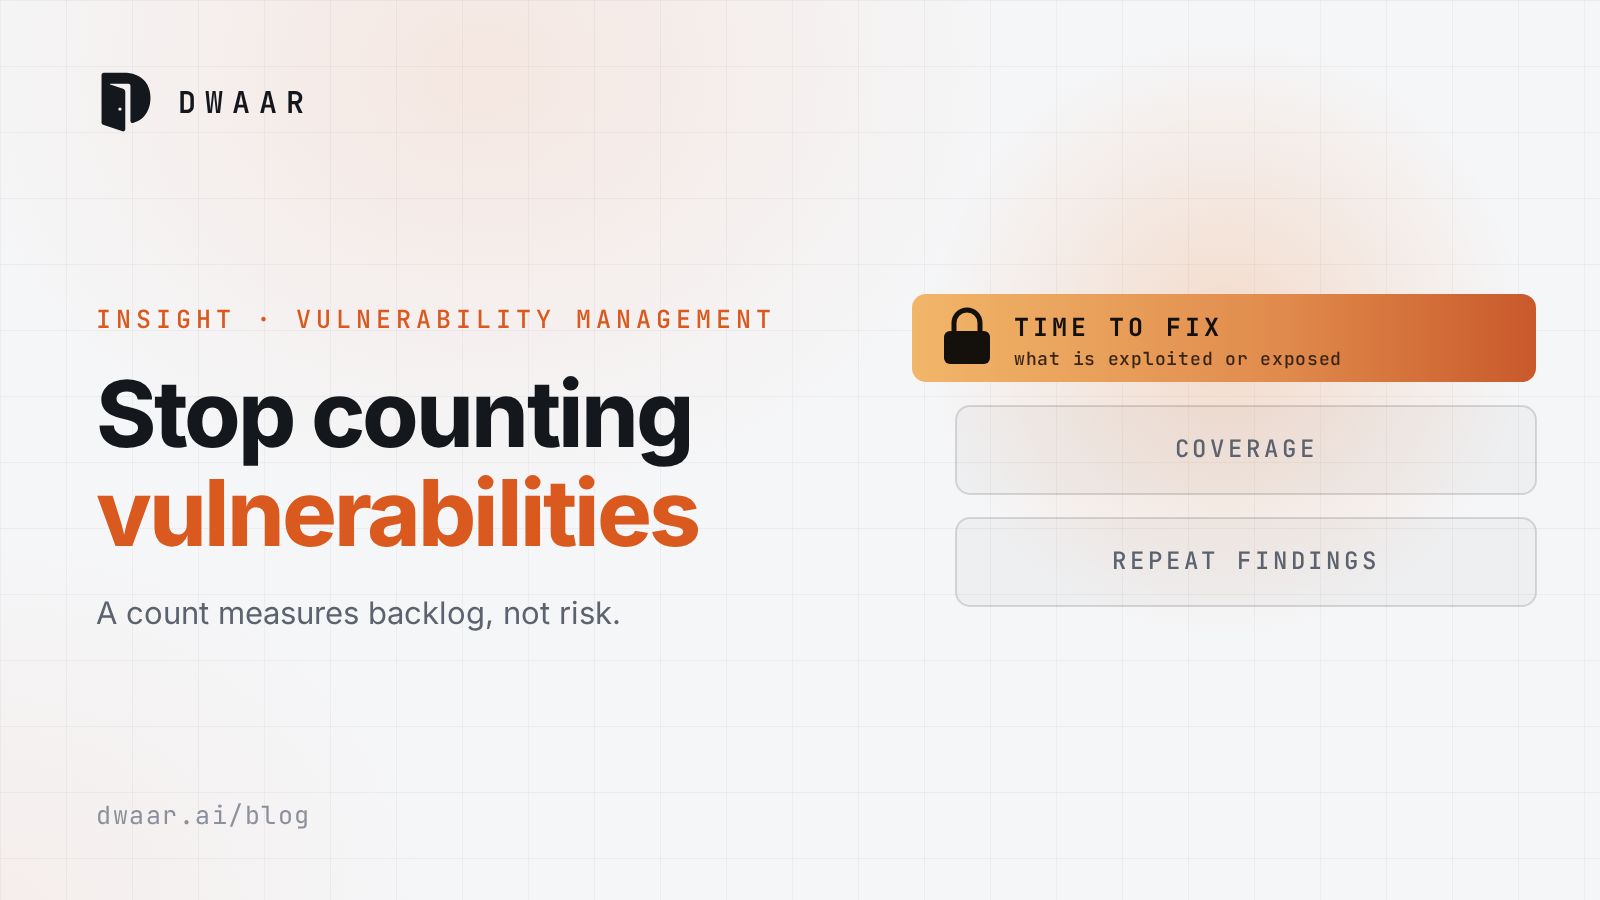
Time to fix what is exploited or exposed. Scope this to findings that are in KEV or sit on a publicly exposed asset. CISA's FAQ on BOD 22-01 says organizations should use KEV "as an input to their vulnerability management prioritization framework", and the catalog page carries the same sentence, so add EPSS, whose scores NIST describes as estimated probabilities that a CVE will be observed to be exploited in the wild within the next 30 days. It is a probability, not a verdict.
This metric lives or dies on two definitions. When does the clock start? BOD 26-04 uses the earlier of the KEV listing or the agency's own identification, and I would copy that rule. What counts as fixed? NIST SP 800-40 Rev. 4 describes patch management as running through "verifying the installation of patches", a stricter bar than a closed ticket.
Report the oldest open item next to any average. Mandiant's own figure shows why: leaving 15 outliers in moves its average from five days to 47.
Coverage of what you own. Every other number describes only what got scanned. So build the denominator from outside the scanner, from cloud accounts, registries and source control, and report the share that was scanned recently. BOD 26-04 points the same way by requiring agencies to attest quarterly to their publicly exposed IP addresses and domains. You cannot secure what you cannot list, and this is where that idea turns into a number. Dwaar works on this denominator: discovering what you ship from source control, registries and cloud accounts, scanning it, and putting the results in one findings list with EPSS and KEV signals.
Repeat findings. Count how often a closed finding comes back on the same asset. A fix that returns on the next rebuild was not a fix, and this is the one number here that says whether remediation reaches the cause. I have no public statistic on how often this happens, so treat it as my recommendation, not a benchmark.
Every one of these can be gamed
The gaming column is my reasoning, not a study. Decide your definitions before someone with a deadline decides them for you.
| Metric | What it tells you | How it gets gamed | What makes that harder |
|---|---|---|---|
| Open findings | Whether the backlog outruns your capacity | Narrow the scan scope, bulk close as accepted risk | Never report it without coverage beside it |
| Time to fix | Whether you move faster than the attacker | Start the clock at ticket creation, count a mitigation as patched, drop outliers | A written clock rule, verified fixes, the oldest open item |
| Coverage | How much of your estate the numbers describe | Shrink the denominator, count a shallow scan as covered | A denominator from systems of record, scan depth stated |
| Repeat findings | Whether fixes reach the cause | Rename, re-scope or merge findings so they no longer match | Match on the flaw and the asset, not a ticket ID |
Accepted risk can flatter the count and time to fix without changing anything in production. Count it separately and give it a date, because a waiver should expire.
Where this stops applying
Keep the count. A trend line in open findings tells you whether the backlog is growing, and that is a real staffing signal. Label it as capacity, not risk.
Time to fix has nothing to say about a flaw with no patch to time. In Mandiant's 2023 set, 97 of 138 vulnerabilities were exploited as zero-days. MOVEit Transfer CVE-2023-34362 was a SQL injection zero-day that the CL0P ransomware gang exploited from 27 May 2023. No backlog metric could have flagged it first. What you had left was reducing exposure and responding fast.
KEV has limits too. An entry needs a CVE ID, clear remediation guidance and reliable evidence of exploitation, so it trails new attacks and misses flaws without a CVE. If KEV is your whole definition of what matters, you are measuring how fast you respond to history.
Try this on your own findings
Export your open findings and keep only those whose CVE ID is in the KEV catalog. Next to each one, write whether its asset is publicly exposed, and its age, measured from the earlier of its KEV listing or the day you first identified it. Sort by age. The top row is a more honest headline than your total, and any row where you cannot fill in the exposure column is your coverage problem with a name on it.
References
- 2026 Data Breach Investigations Report, Verizon Business, May 2026 (month from the page's metadata; the page shows no publication date)
- 2026 DBIR Executive Summary, Verizon Business, June 2026
- Time-to-Exploit Trends: 2023, Google Cloud (Mandiant), 16 October 2024
- GAO-18-559: Actions Taken by Equifax and Federal Agencies, U.S. GAO, 30 August 2018
- BOD 22-01, CISA, 3 November 2021 (revoked 10 June 2026)
- BOD 26-04, CISA, 10 June 2026
- CISA tells govt agencies to patch critical exploited flaws in 3 days, BleepingComputer, 11 June 2026
- Known Exploited Vulnerabilities Catalog, CISA, living page with no publication date
- Exploit Prediction Scoring System, FIRST, living page with no publication date
- NIST CSWP 41: Likely Exploited Vulnerabilities, NIST, 19 May 2025
- SP 800-40 Rev. 4, NIST, April 2022
- AA23-158A: CL0P Exploits CVE-2023-34362 MOVEit Vulnerability, CISA, 7 June 2023